People often tell us one reason they use our Behavior Style model is because it’s simple, easy to remember, and easy to apply. Although we find value in many of the more complex frameworks and models in the marketplace, it is more challenging to practically apply those in real time. That’s one reason we have kept our model simple.
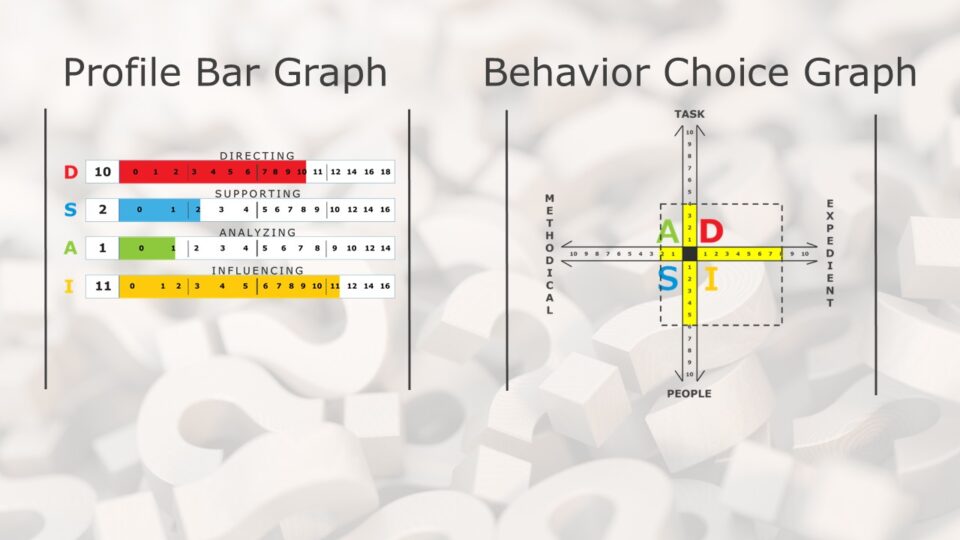
At the same time, people who look deeper discover there is a lot of nuance and depth in the model. A great example of that is the difference between the Profile Bar Graph and the Behavior Choice Graph.
This distinction may seem subtle, but it reflects real differences in how people behave and significantly enriches our understanding of the model.
Since this difference can be more challenging to grasp, I wanted to write a summary to make it more understandable.
Simply Stated:
The Profile Bar Graph captures your preferred way of behaving in the context you were thinking of when you took the assessment, while the Behavior Choice Graph reflects your perception of your expressed behavior.
If that explanation makes it click for you, please stop reading here. No reason to get into the technical details. But if you’d like to know more, here’s a bullet list about the two graphs:
The Profile Bar Graph:
- Reflects your preferred way of behaving in the context you were thinking of when you took the assessment.
- Based on the first 24 responses you provided in the Behavior Style Self or Discover Your Style-44 assessments.
- Uses more broad, descriptive traits (e.g., analytical, friendly, confident) that are more internal and less behaviorally explicit.
- Captures the behavior that gives you the most energy.
The Behavior Choice Graph:
- Represents the specific behaviors you believe you actually demonstrate (“how you show up”) to be effective.
- Based on your answers to the next 20 responses in the Behavior Style Self or Discover Your Style-44 assessments.
- Uses more concrete, observable actions (e.g., speaks slowly after thinking, makes direct eye contact).
- Does not capture where you tend to give energy (if the results differ from your Profile Bar Graph).
Why Would They Be Different?
Differences can occur because people may adjust their behavior in ways they believe help them to succeed in their role, environment, or based on life experiences. As a result, someone may naturally prefer one style but behave differently. This is common, too. Only about 20% of the population fully match between the two graphs.
Here’s a practical example of how this might look:
Crystal has a clear Analyzing Style preference reflected in her Profile Bar Graph report. She loves to research, check the data, and make sure things are accurate. Not just close, but spot-on accurate.
Crystal also grew up in a demonstrative family environment, smiles and laughs easily and often, and has warm, friendly presence. She tends to make direct but comfortable eye contact and comes across as empathetic. Her Behavior Choice Graph indicates highly relational, people-focused behavior and very little Analyzing.
People who don’t know about Crystal’s Analyzing preference would be surprised to know how much she internally analyzes what they say and how clearly she remembers it. She doesn’t do that because she is disingenuous or has negative motives or intent. She does it because Analyzing deeply comes naturally to her. And even though she doesn’t get much energy from the behavior indicated by her Behavior Choice Graph, it’s not hard for her to show that relational behavior.
Why Does This Matter?
Being aware of the differences between the Profile Bar Graph (preference) and the Behavior Choice Graph (what someone actually does) is useful because it adds context and flexibility to how we understand behavior—both our own and others’.
For individuals with a difference, here are a couple of reasons why knowing about this difference can be personally helpful.
- Self-awareness of energy vs. effort: They can recognize when they are operating outside their natural style—which often requires more energy—and manage that intentionally.
- Better career and role alignment: A gap may signal that their role demands behaviors that don’t come naturally, helping them decide whether to adapt, rebalance, or seek different responsibilities.
For others interacting with these individuals, it can be helpful for a few reasons.
- Reduces misinterpretation: Others won’t assume that visible behavior fully defines the person. For example, someone acting more assertively may not prefer that behavior.
- Improves communication and empathy: Understanding that behavior may be an adaptation helps people respond with more patience and curiosity rather than judgment.
- More effective collaboration: Teammates can better support one another—balancing tasks, communication styles, and expectations based on tendencies, energy preferences, and situational behavior.
Going back to Crystal, it matters because if you didn’t know about her Analyzing preference, you might be surprised to discover how thoroughly she listened to what you said and how clearly she remembered it. If you felt she was genuine, you’d probably admire that trait. If you didn’t perceive her as being authentic, you might suspect her of being disingenuous or of having negative intent, neither of which would be true.
In Closing…
Awareness of this potential difference helps people avoid seeing others too narrowly and instead recognizing that behavior is dynamic and often situational, leading to more effective relationships and better performance.

Very insightful. Thank you for the clarification and examples. I very much appreciate the model and have learned a great deal from it. It has been instrumental in my professional and personal development. Thank you!
Thank you for sharing this Julaine! It’s always good to hear how the model has been helpful, and even more so when that’s true both professionally and personally. We’re thankful to be able to make that kind of positive impact in people’s lives.