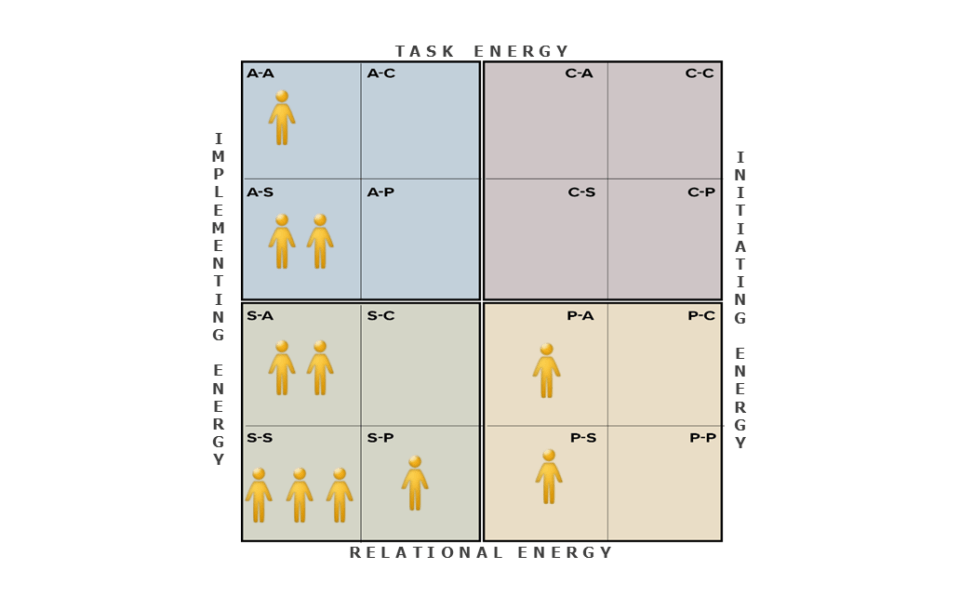
Team Distribution Chart
The Team Behavior Style Distribution Chart has been proven to be a valuable resource for gaining insights into team dynamics and pinpointing avenues for enhancing team performance.
Here are specific ways to leverage the Team Distribution Chart:
- Recognize Team Strengths and Blind spots: The chart allows team members to identify their individual Behavior Styles in relation to their teammates'. This understanding fosters appreciation for team strengths and helps identify any blind spots within the team. For instance, if the team lacks an Analyzer, it may signal the need to enhance planning and organizational skills.
- Enhance Communication and Collaboration: The chart aids in comprehending how distinct Behavior Styles influence communication and collaboration approaches. For instance, team members below the Midline might prefer verbal communication, while those above it may lean toward written communication. By recognizing these differences, team members can improve their ability to communicate effectively with one another.
- Boost Team Effectiveness and Efficiency: The chart assists in identifying optimal task assignments and roles based on Behavior Styles. For instance, individuals with a certain Behavior Style may excel at coming up with critical projects, while those with a different Behavior Style may be especially adept at implementation. Better aligning tasks and roles with Behavior Styles enables team members to work more efficiently and effectively.
Here are some recommendations for facilitating discussions about the Team Distribution Chart:
- Review the Chart with the Team: Present the chart to the team and encourage members to identify their primary and secondary Behavior Styles.
- Discuss Strengths and Challenge Areas: Initiate a conversation where team members share insights into their strengths and blind spots based on their Behavior Styles.
- Address Blind Spots: Encourage the team to explore ways to reduce challenge areas they might have to its distribution.
- Enhance Communication and Collaboration: Promote discussions on how to improve communication and collaboration by considering each team member's Behavior Style.
- Optimize Team Effectiveness and Efficiency: Engage the team in brainstorming ways to maximize team effectiveness and efficiency, taking into account their diverse Behavior Styles.
(NOTE: It’s essential to remember that the Team Distribution Chart is a tool designed to enhance team performance. To achieve the best results, it should be employed in conjunction with other strategies like regular team meetings, performance evaluations, and feedback sessions.)

Review the sample Distribution Chart above and think about the following questions:
- Implementing-oriented individuals tend to pay attention to how results can be achieved. Accordingly, they may be perceived to be deliberate, detailed and moderate.
- Implementing-oriented individuals are also systematic in their work and like to have time to process information prior to making a decision so they can be certain they are taking the best course of action. They want facts, data and detailed explanations more than big picture statements.
- Initiating-oriented individuals tend to pay attention to how quickly results can be achieved. Accordingly, they may be perceived to be assertive, outspoken and bold.
- Initiating-oriented individuals process information quickly, so they make decisions based on an instinctive response to facts, data or details. They want to get to the bottom line and move forward quickly.
What does this Distribution Chart tell us about how team members might:
- Go about making decisions?
- Approach a new task or project?
- Initiate new ideas to improve team performance and deliverables?
- Use effective and efficient methods or systems to deliver products and/or services?
- Improve a product and/or service?
If your interested in bringing this program into your organization or getting certified to do your own delivery, contact us!
